

Know Your NetworkConnectivity diagrams: from fiber to a field work plan
An experienced engineer's time is too valuable to spend tracing the same fiber and its far end all over again.
A network takes years to build. Nodes grow, equipment changes, and connections move. Some details stay in documents; others stay with the people who did the work. Before the next visit, the team has to piece that knowledge together again.
It is better to answer ‘what is connected here?’ by opening a diagram.
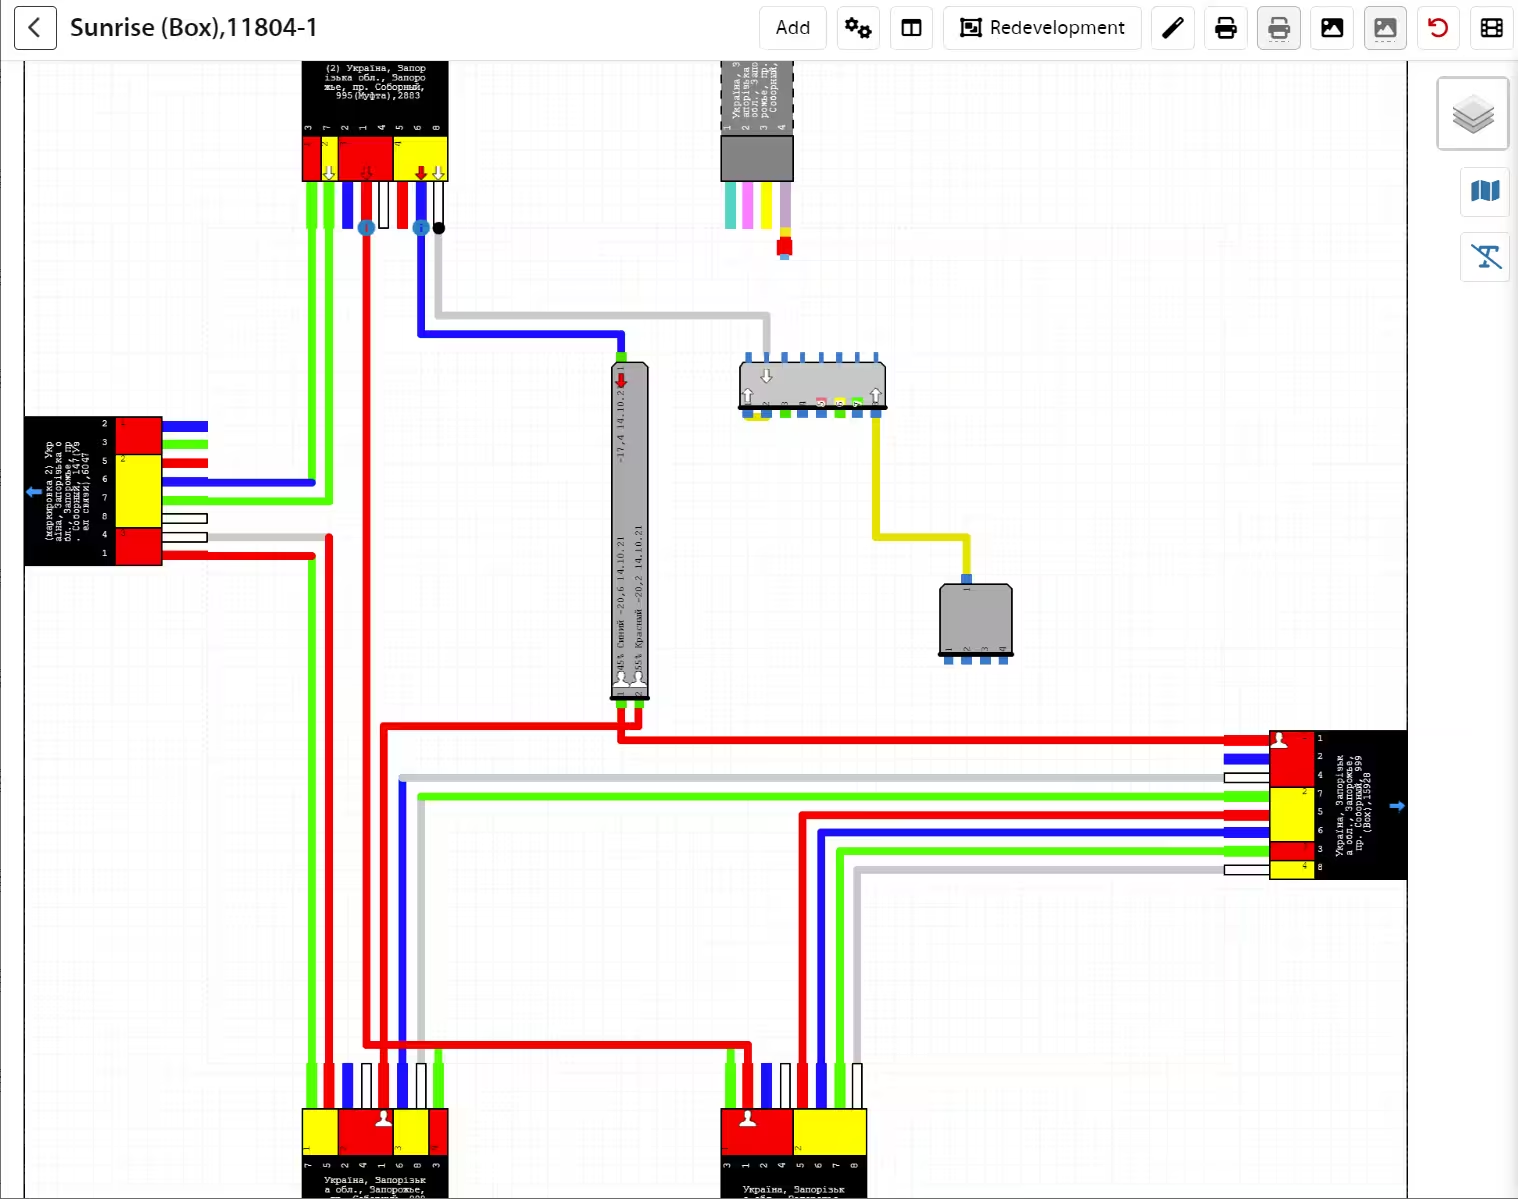
Inside the node
The USERSIDE connectivity diagram shows cables and individual fibers, cross-connects, splitters, equipment ports, and the connections between them. Colors, numbering, and endpoint details help an engineer understand a node even on a first visit.
The diagram uses the same objects recorded in the system. When an engineer records a connection, the underlying cable and equipment connectivity data changes with it. That information is also available from the object records. There is no separate drawing to keep in sync.
Devices can be repositioned, cable routes adjusted, and lines reshaped. A complex node can be laid out so that the next person can read it without retracing the original engineer’s steps.
Beyond a single node
Work that spans several nodes calls for more than a set of separate diagrams. You need to see both the connections inside a splice closure and where they continue beyond it.
In the USERSIDE global connectivity view, diagrams for splice closures and network nodes can be arranged on one canvas. You choose the objects and their positions. Internal connections remain visible alongside the links between nodes.
Selecting a connection highlights its path through the objects on that canvas. The team can examine a whole segment without reconstructing the route across separate windows.
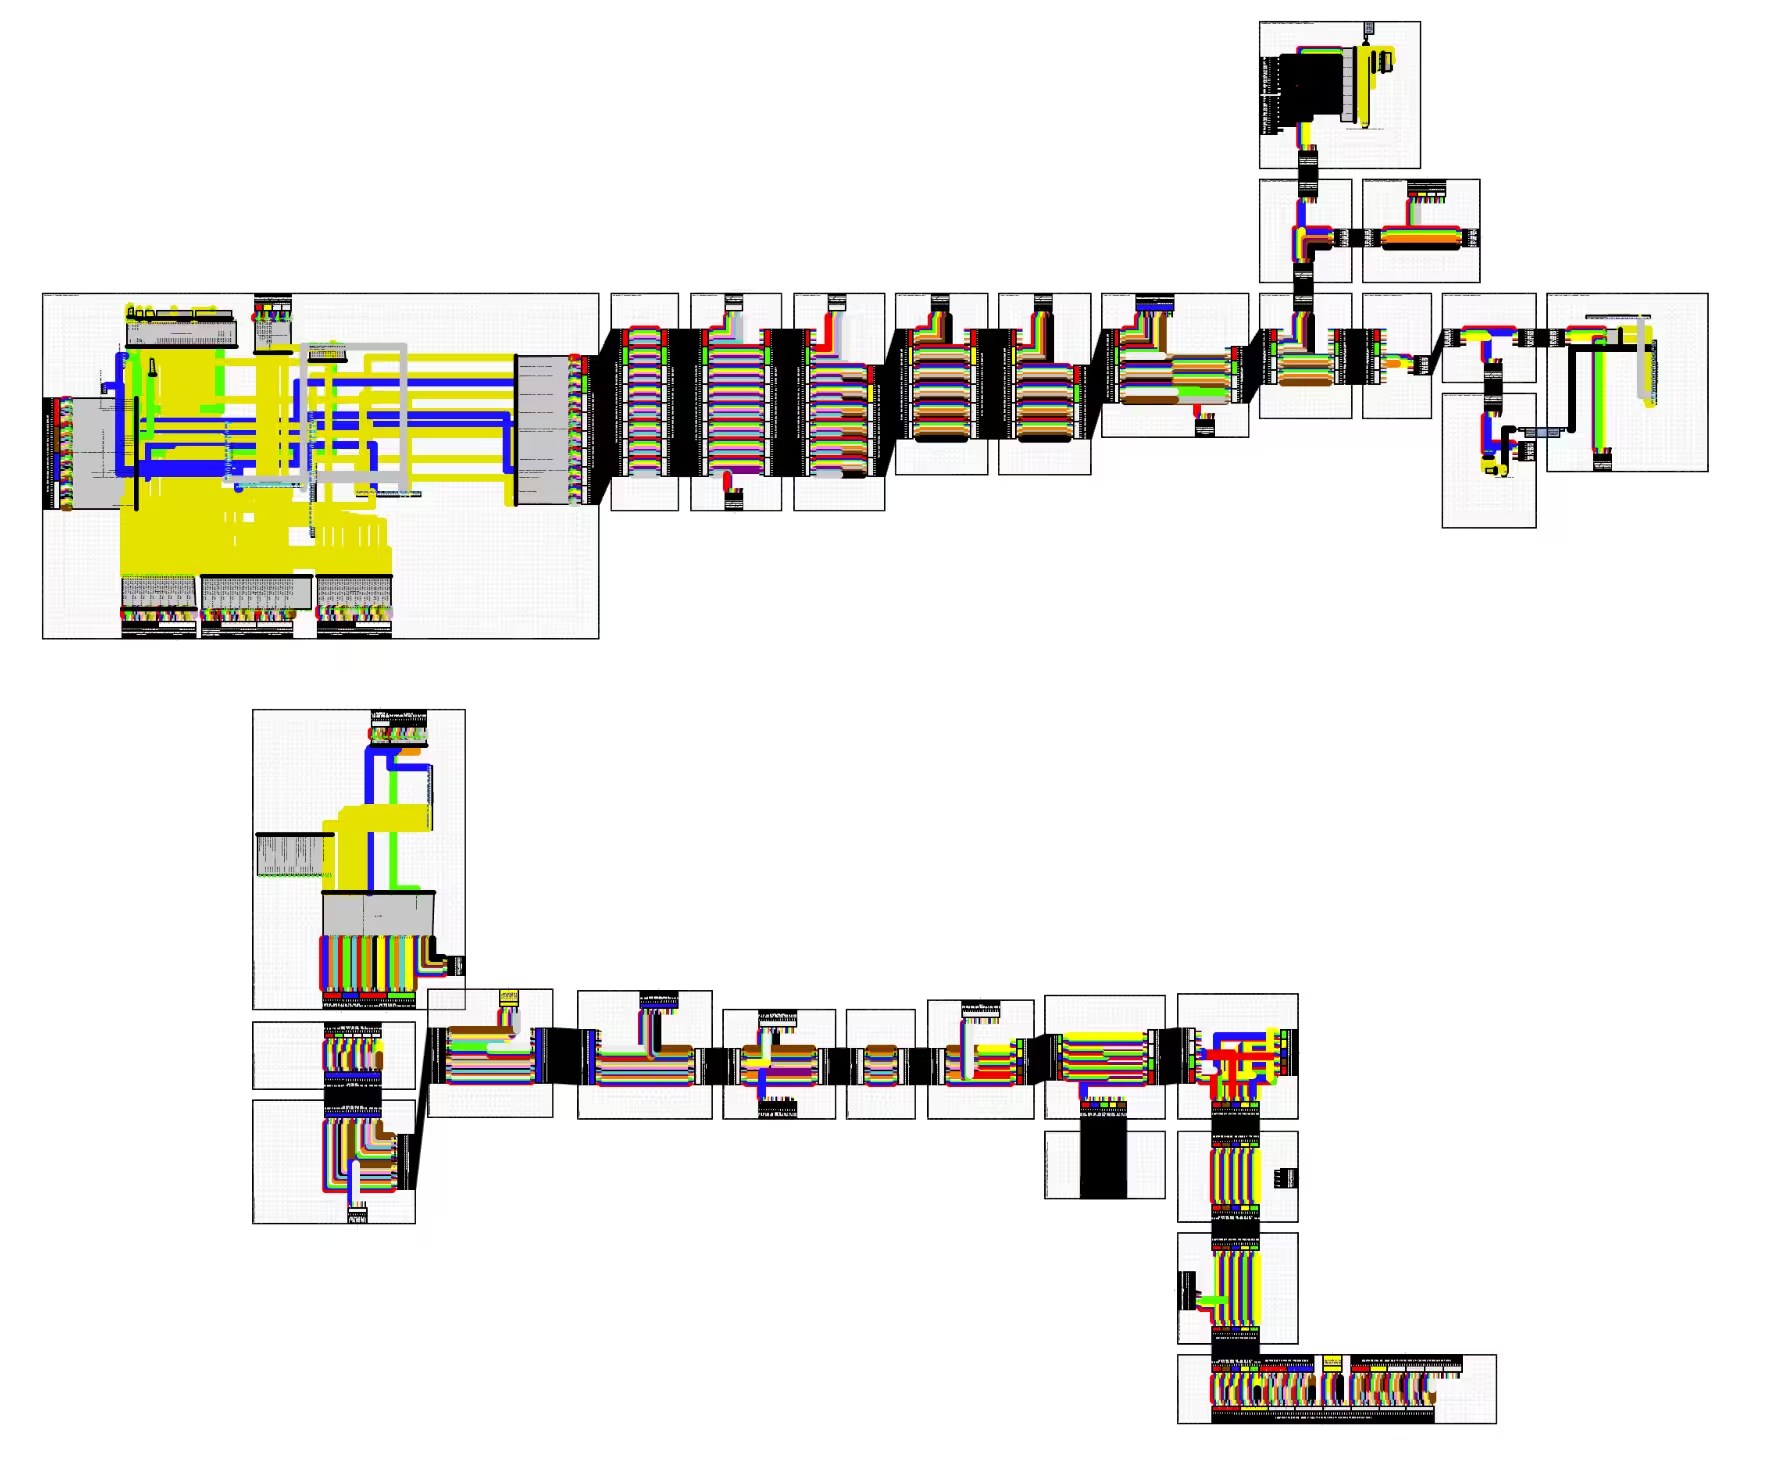
For a particular equipment port, splitter, or cross-connect adapter, you can see which subscribers depend on it. Before changing a connection, the engineer can check whose service passes through that point.
The combined diagram can be saved as SVG for printing, discussion with colleagues, or inclusion in work documents.
The diagram and the map work together
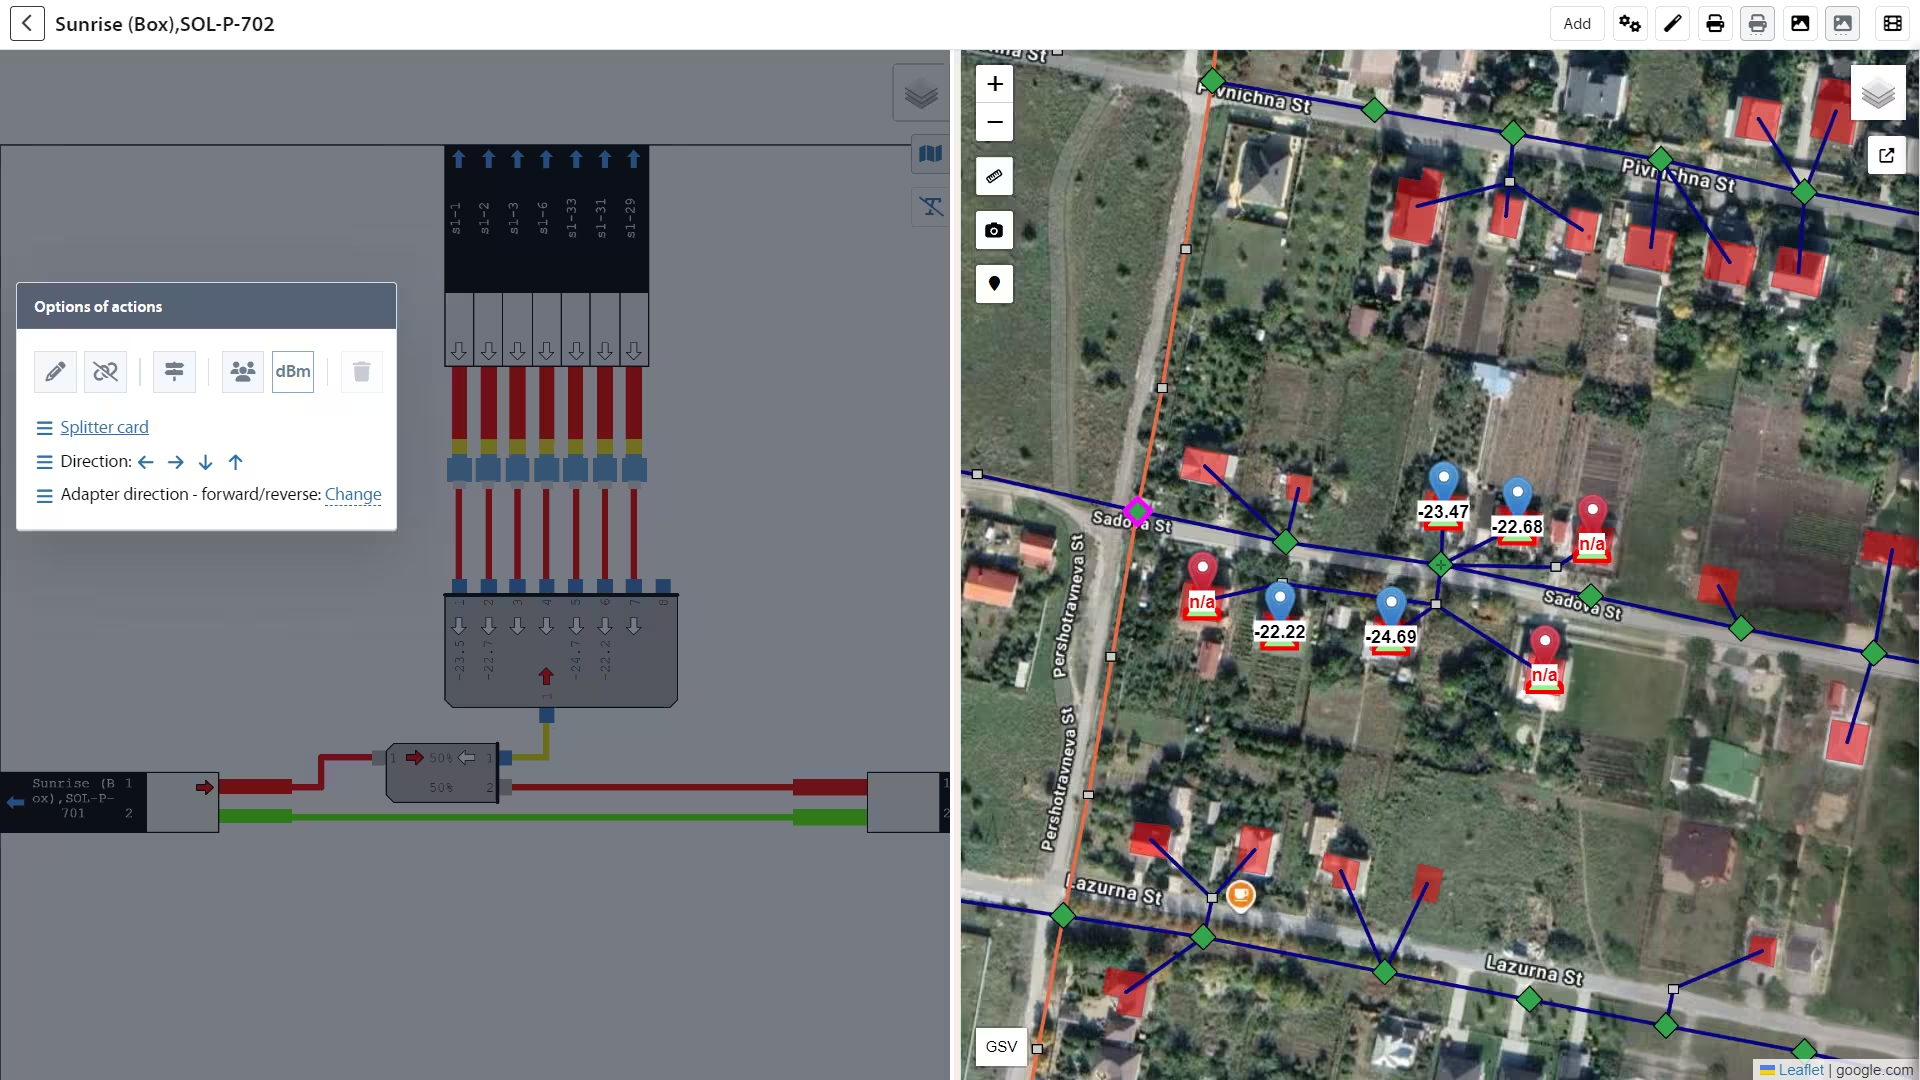
One view places the map beside the connectivity diagram. Both sides are interactive and linked: selecting an object in the diagram highlights it on the map, and the reverse works too. Choose an incoming cable to see its route on the ground, or select a line on the map to locate it in the node.
Integration with PON equipment adds optical signal readings for connected subscribers. Polling data shows the receive levels of connected ONUs at splitter ports. Subscriber devices and their readings can also be shown on the map.
A reading in dBm gains context: a specific splitter output, a connected subscriber, and a building on the map. The engineer does not have to find the same object manually in several views of the network.
Plan it on the diagram first
A node needs another splitter; some connections must move to a different cable. Before sending a crew, it helps to examine the intended configuration in detail.
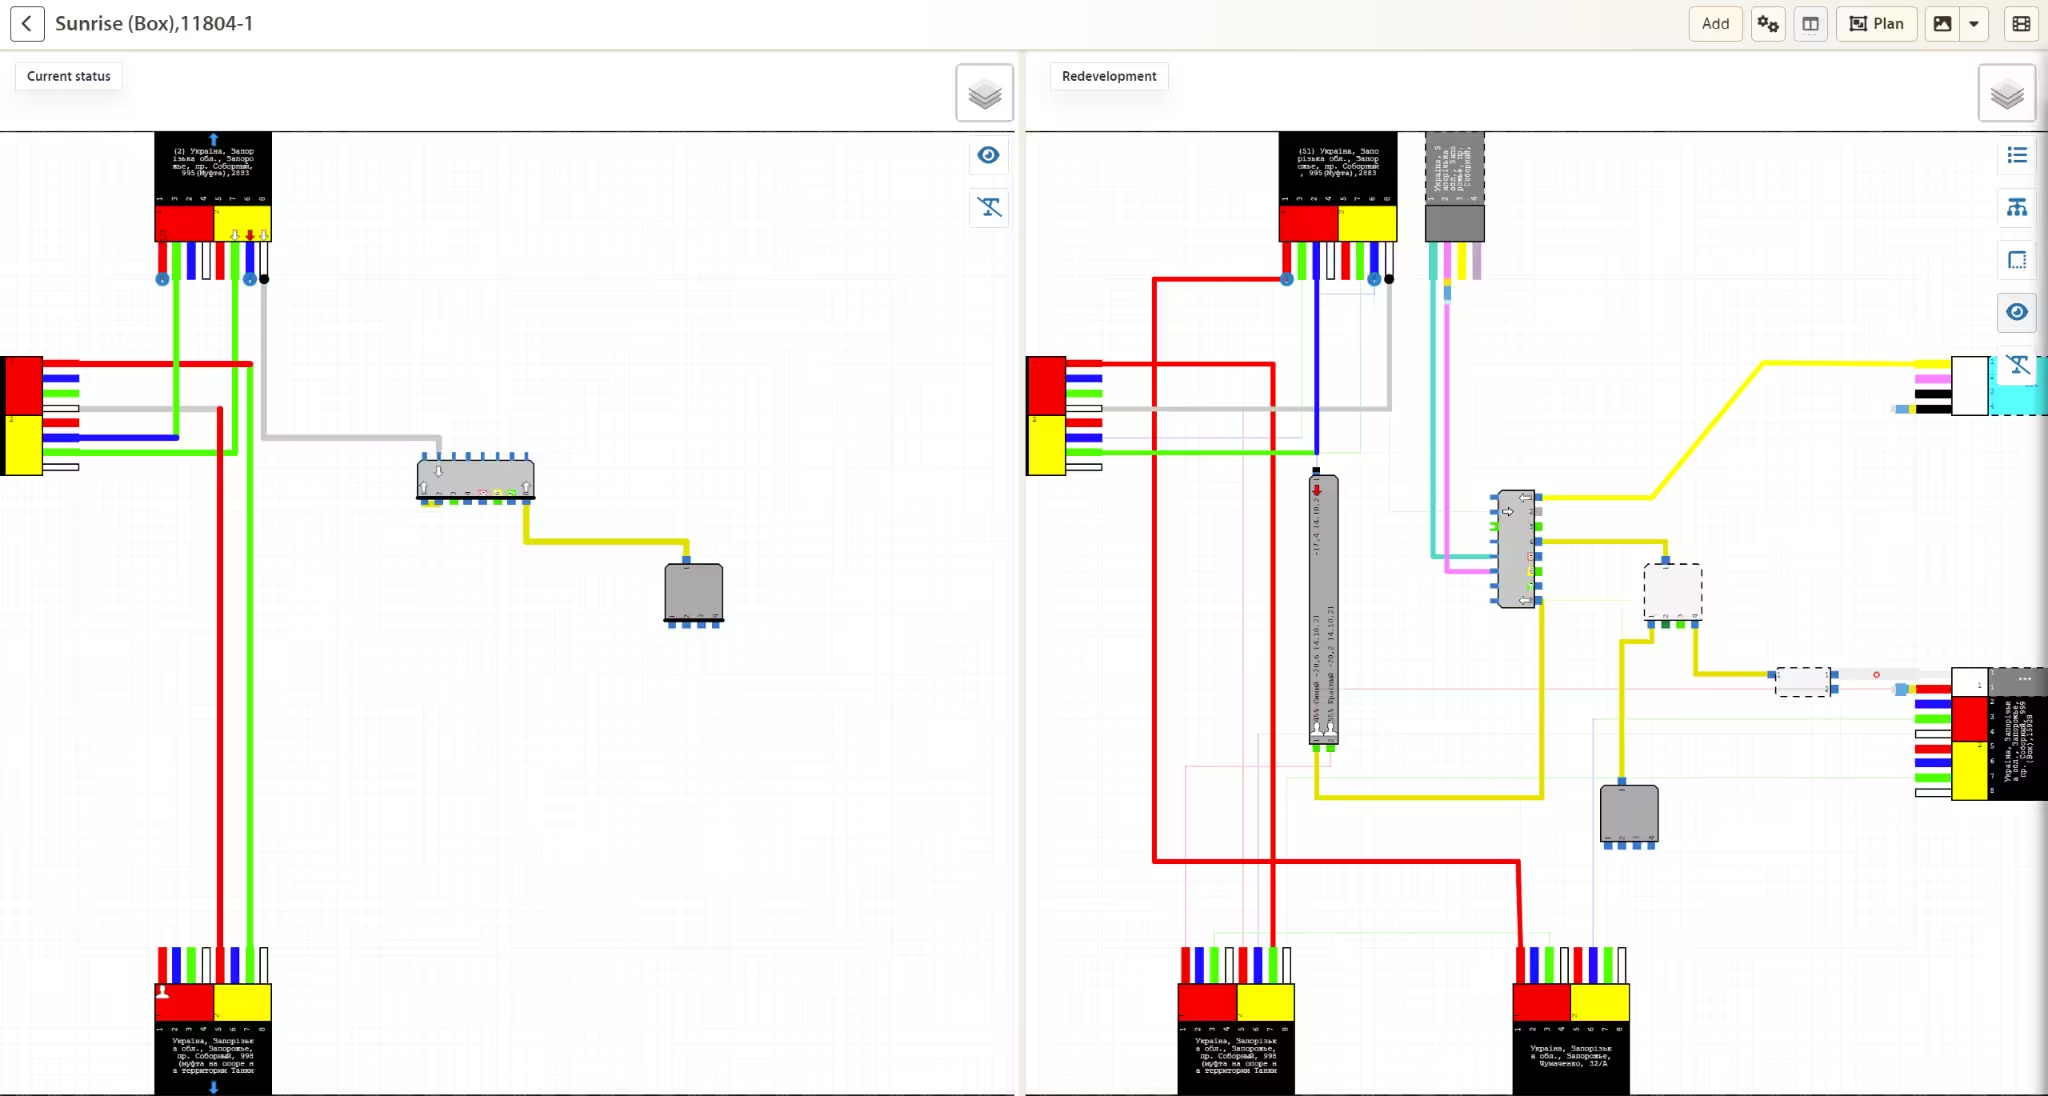
In replanning mode, proposed changes are kept separate from live connectivity. Several options can be saved, planned objects added, and the current state opened beside the proposal.
The engineer can see which connections will remain, which must be broken, and what the finished node should look like. There is time to check the details and discuss them with colleagues. The proposal does not overwrite the recorded state of the network.
A plan the field crew can use
A network may contain fifty thousand splice closures. The fiber technician on site needs an exact diagram of just one.
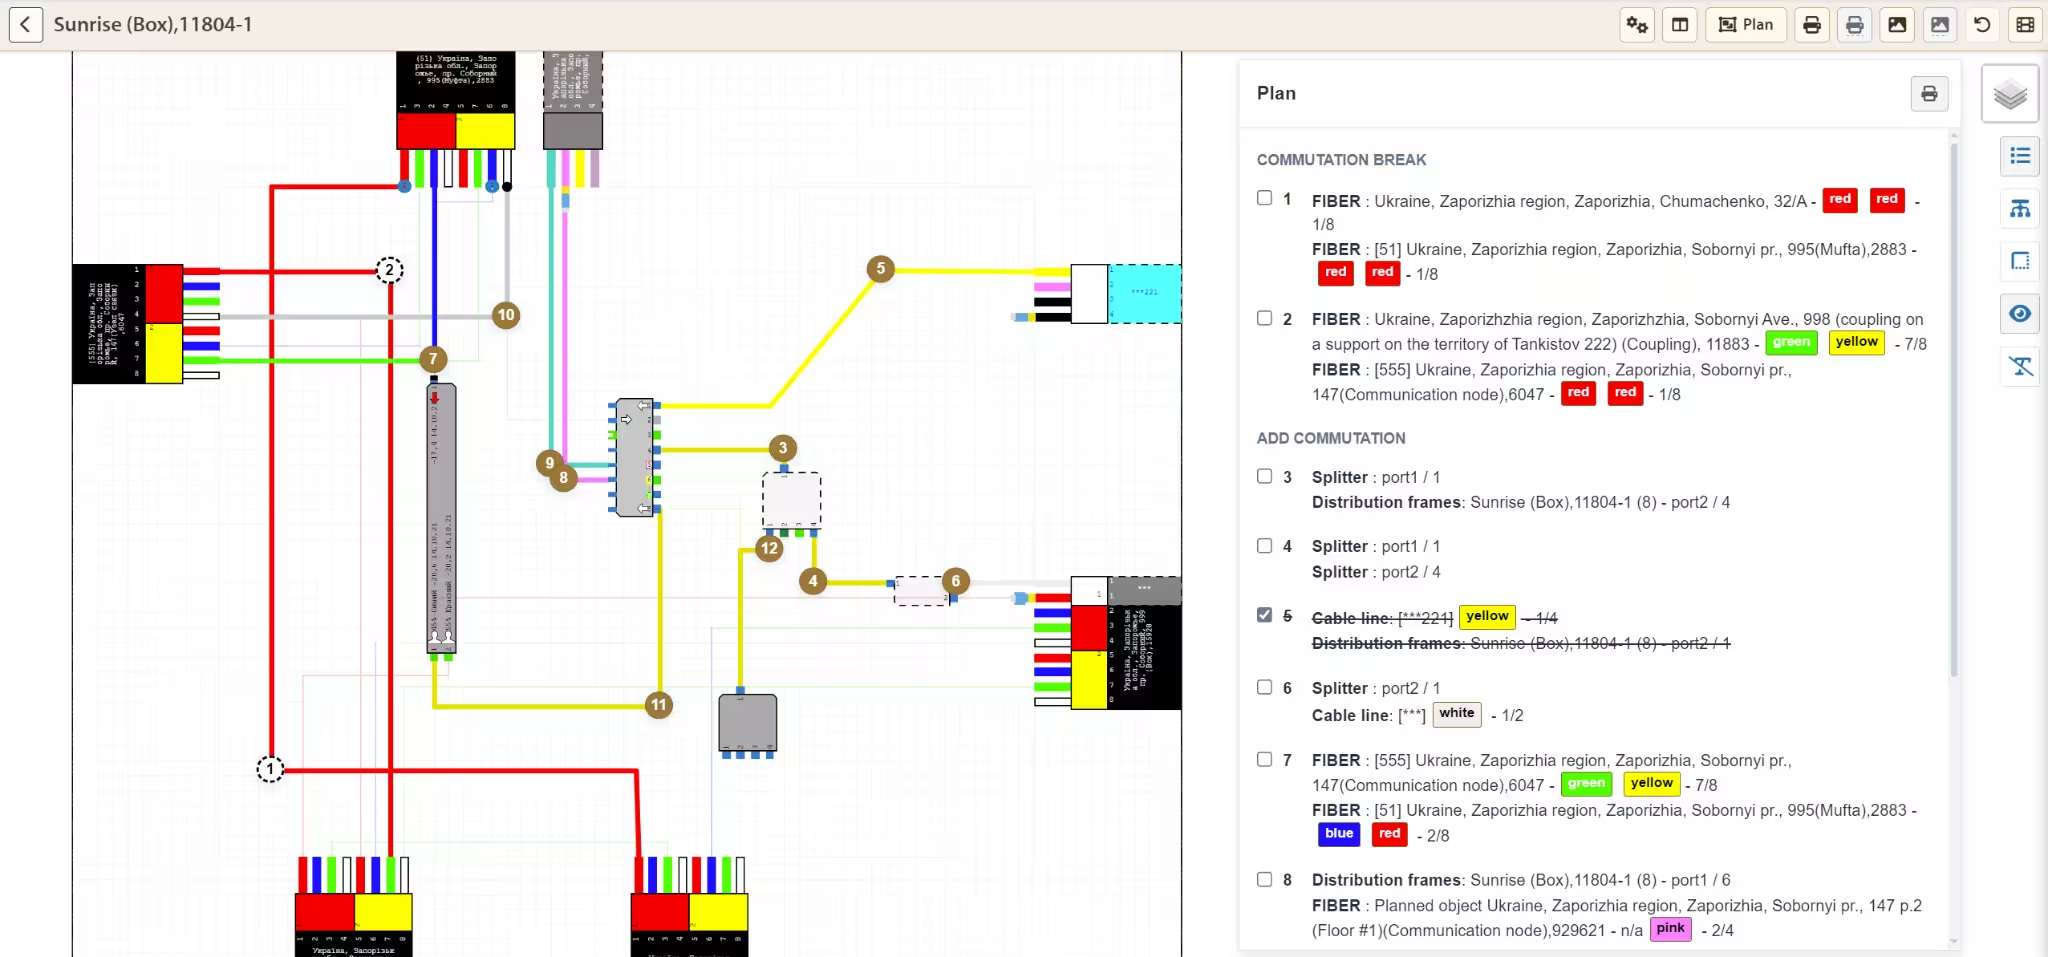
The crew can receive a prepared diagram and a work plan with a checklist. It specifies which connections to break and which to make, down to the cable, fiber, and port.
Each operation has a number matching a mark on the diagram. Completed steps are checked off in the list. The team can review the planned end state, then return to an individual action without losing its place in the overall plan.
Instead of another explanation over the phone, the engineer and fiber technician share a task they can verify step by step. Preparation time benefits the whole crew.
After the work is done, planned connections are confirmed or rejected. If the crew had to depart from the plan on site, the system should retain the connections that were actually made.
What the node looked like before
Sometimes the answer is in an earlier diagram. Which port held that fiber? What did the node look like before it was expanded? What changed between two site visits?
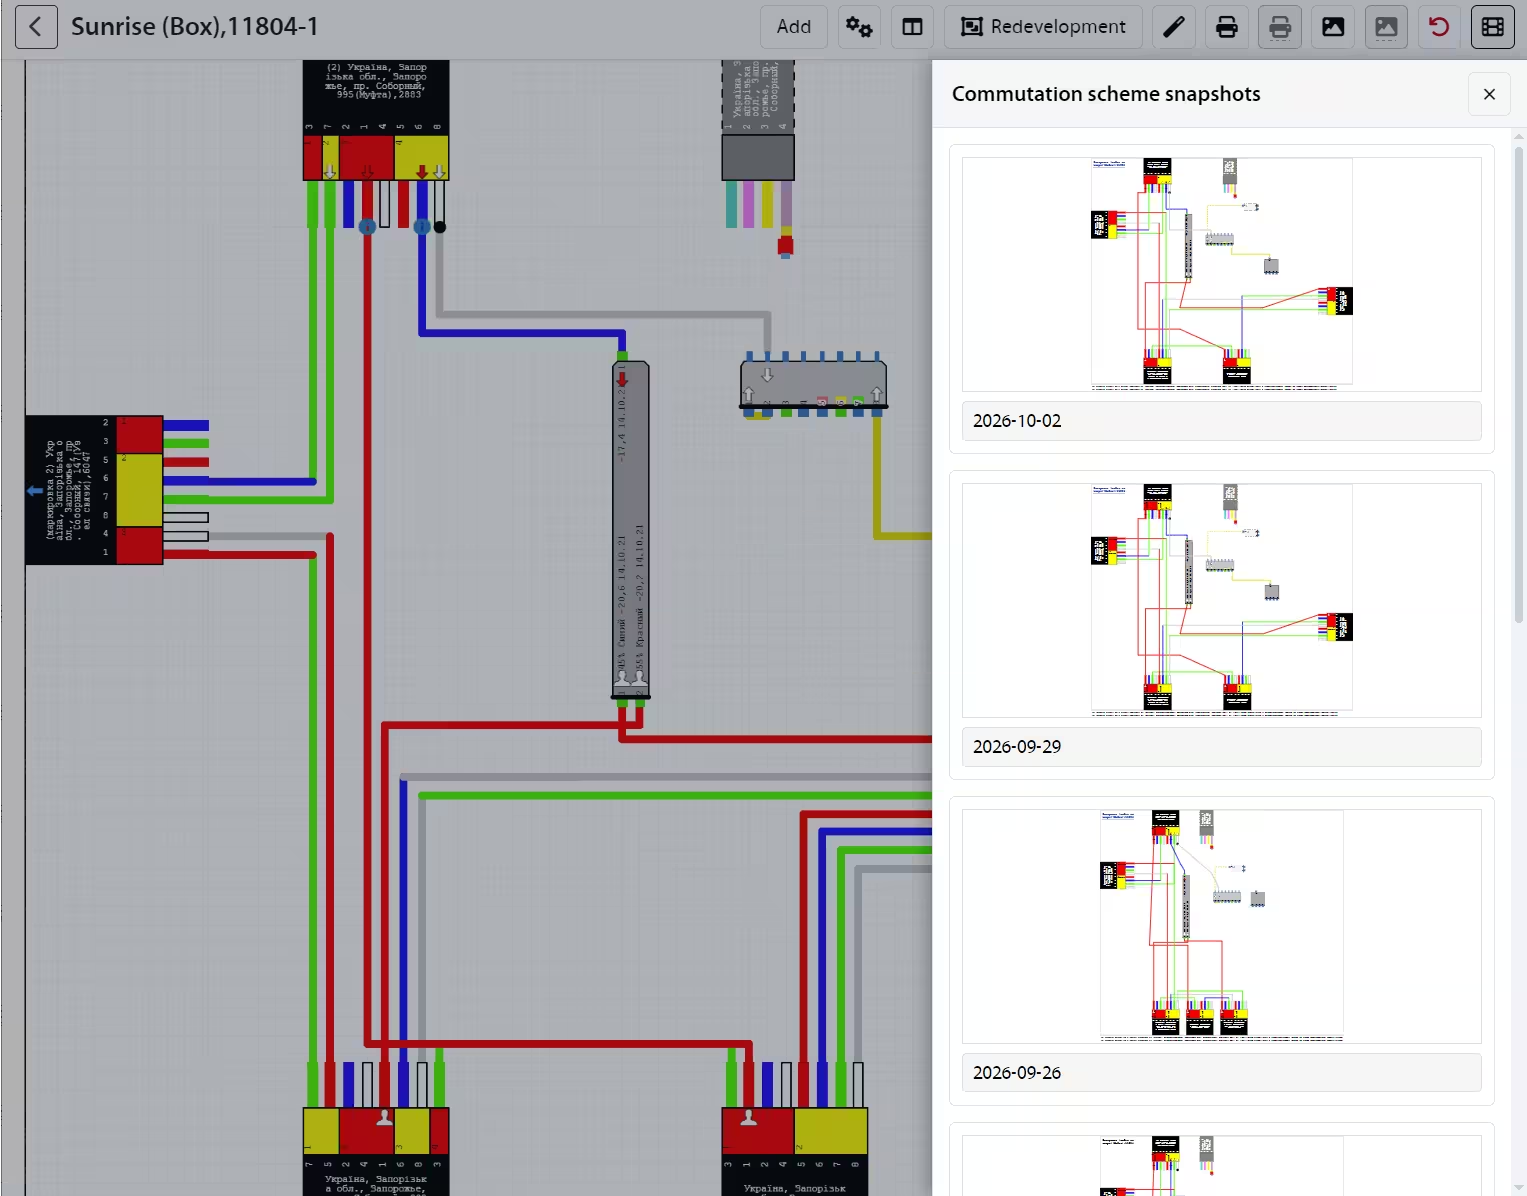
USERSIDE saves diagram snapshots when connections are made or broken. The history is available from the working diagram, so an engineer can open a saved state and inspect the earlier connections.
Snapshots are stored as SVG. The vector format stays sharp when enlarged and can be printed or used in other documents.
In everyday work
Connections can be created or removed, and their layout adjusted, without reloading the page. A connectivity wizard helps with bulk operations; free fibers and adapters can be connected without disturbing occupied ones. Many actions can be undone, including with Ctrl+Z.
The diagram can be saved as SVG for printing or sharing outside the system. Repeated operations take fewer manual steps, and the prepared material is useful in the field as well.
Give time back to the team
We build USERSIDE for organizations that take their infrastructure seriously. For them, an accurate diagram, a prepared work order, and a preserved history are ordinary requirements. The size of the operator matters less than the standard it sets for its work.
When much of the day goes into searching, reconciling records, and explaining the same connections again, it can look as though the team needs more people. Before adding staff to carry that burden, it is worth giving the existing team more time for its real work.
With current connectivity records, the next engineer starts from a reliable picture. They do not have to collect information the company already has. The same team can do more without hiring people simply to maintain fragmented records.
That time can go into network development, new connections, and service quality: the work the organization is there to do.
It is good when hard-won knowledge stays with the company.
And when the people who built that knowledge have room to move forward.
Connectivity diagrams are one part of USERSIDE.
Explore other working scenarios in the USERSIDE demo and see how infrastructure, tasks, and data connect.
Explore USERSIDE